图的度数分布
import collections
import matplotlib.pyplot as plt
import networkx as nx

G = nx.gnp_random_graph(100, 0.02)

degree_sequence = sorted([d for n, d in G.degree()], reverse=True)  # degree sequence
# print "Degree sequence", degree_sequence
degreeCount = collections.Counter(degree_sequence)
deg, cnt = zip(*degreeCount.items())

# #as an alternation, you can pick out the top N items for the plot:
#d = sorted(degreeCount.items(), key=lambda item:item[1], reverse=True)[:30]   # pick out the up 30 items from counter
#deg = [i[0] for i in d]
#cnt = [i[1] for i in d]

fig, ax = plt.subplots()
plt.bar(deg, cnt, width=0.80, color='b')

plt.title("Degree Histogram")
plt.ylabel("Count")
plt.xlabel("Degree")
ax.set_xticks([d + 0.4 for d in deg])
ax.set_xticklabels(deg)

# draw graph in inset
plt.axes([0.4, 0.4, 0.5, 0.5])
Gcc = sorted(nx.connected_component_subgraphs(G), key=len, reverse=True)[0]
pos = nx.spring_layout(G)
plt.axis('off')
nx.draw_networkx_nodes(G, pos, node_size=20)
nx.draw_networkx_edges(G, pos, alpha=0.4)

plt.draw()
Source for reference:
degree-histogram, networkx

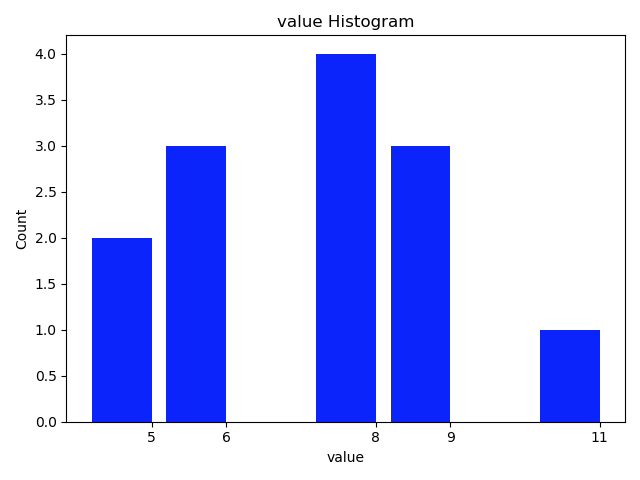
Draw the histogram for values of dict
import collections
import matplotlib.pyplot as plt

dict_granuLevel = {'1283': 9, '291': 5, '451': 6, '964': 8, '1093': 5, '525': 8, '878': 11, '1553': 9, '1107': 6, '1588': 8,
             '1435': 6, '861': 8, '1054': 9}

value_sequence = sorted([d for d in dict_granuLevel.values()], reverse=True)  # value sequence
print("value sequence:", value_sequence)
valueCount = collections.Counter(value_sequence)
val, cnt = zip(*valueCount.items())

# # as an alternation, you can pick out the top N items for the plot:
# d = sorted(degreeCount.items(), key=lambda item:item[1], reverse=True)[:10]   # pick out the up 10 items from counter
# val = [i[0] for i in d]
# cnt = [i[1] for i in d]

fig, ax = plt.subplots()
plt.bar(val, cnt, width=0.80, color='b')

plt.title("value Histogram")
plt.ylabel("Count")
plt.xlabel("value")
ax.set_xticks([d + 0.4 for d in val])
ax.set_xticklabels(val)

plt.show()
The function style:
import collections
import matplotlib.pyplot as plt


def plot_histogram(list_input, k=0):
    '''
    draw the histogram for items in list_input
    :param list: list of count_numbers. all items are required to be int.
    :param k: the top k-th count of items to be considered for drawing the plot. default: k=0, plot all
    :return:
    '''
    valueCount = collections.Counter(list_input)
    val, cnt = zip(*valueCount.items())
    print('  len of val, cnt:', len(val), end='')
    if k != 0:
        print(' pick the largest', k, 'cnt for histogram.')
        d = sorted(valueCount.items(), key=lambda item: item[1], reverse=True)[:k]    # pick out the up k items from counter
    else:
        d = sorted(valueCount.items(), key=lambda item: item[1], reverse=True)
        print(' k = 0. Pick all the cnt for histogram.')

    val = [i[0] for i in d]
    cnt = [i[1] for i in d]

    fig, ax = plt.subplots()
    plt.bar(val, cnt, width=0.80, color='b')
    plt.title("value Histogram")
    plt.ylabel("Count")
    plt.xlabel("value")
    ax.set_xticks([d + 0.4 for d in val])
    ax.set_xticklabels(val)
    plt.show()

    return

dict_granuLevel = {'tom': 9, 'cat': 5, 'dot': 6, 'dog': 8, 'hors': 5, 'fao': 8, 'pao': 11, 'koo': 9, 'jan': 6, 'dec': 8,
             'foo': 6, 'doo': 8, 'coo': 9}

value_sequence = sorted([d for d in dict_granuLevel.values()], reverse=True)  # value sequence
print("value sequence:", value_sequence)

plot_histogram(value_sequence, 3)
read more: 用python + networkx探索和分析网络数据
draw the edge_weighted graph:
for network with weighted edges, draw the graph :
###
import matplotlib.pyplot as plt
pos = nx.planar_layout(G)           # pos = nx.spring_layout(G)
labels = nx.get_edge_attributes(G,'weight')
nx.draw_networkx_edge_labels(G,pos,edge_labels=labels)
plt.show()